Home »
Python »
Python Data Visualization
Python | Without Fill Head Arrow in Plots
Here, we are going to learn about the without fill head arrow in plots and its Python implementation.
Submitted by Anuj Singh, on August 04, 2020
In some cases, we need a blank headed arrow or arrowhead without fill. In matplotlib, we are given this feature with fill head and in this article, we are going to present many examples such as, without fill head with different overhang and without fill hatched head.
Illustration:

Python code for without fill head arrow in plots
import matplotlib.pyplot as plt
plt.figure()
plt.arrow(0.05, 0.2, 0.5, 0, linewidth=3.0,
head_width=0.15, head_length=0.25, fill=False)
plt.show()
###############################################################
###############################################################
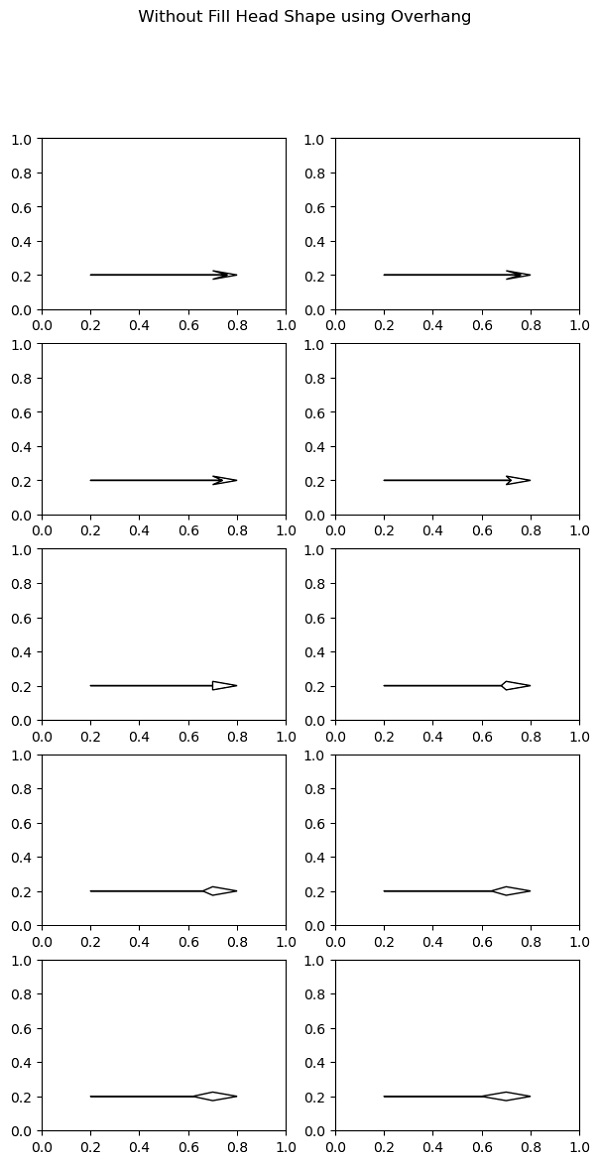
plt.figure(figsize=(7,13))
plt.subplot(521)
plt.arrow(0.2, 0.2, 0.5, 0, overhang=0.6, fill=False, head_width=0.05, head_length=0.1)
plt.subplot(522)
plt.arrow(0.2, 0.2, 0.5, 0, overhang=0.6, fill=False, head_width=0.05, head_length=0.1)
plt.subplot(523)
plt.arrow(0.2, 0.2, 0.5, 0, overhang=0.4, fill=False, head_width=0.05, head_length=0.1)
plt.subplot(524)
plt.arrow(0.2, 0.2, 0.5, 0, overhang=0.2, fill=False, head_width=0.05, head_length=0.1)
plt.subplot(525)
plt.arrow(0.2, 0.2, 0.5, 0, overhang=0, fill=False, head_width=0.05, head_length=0.1)
plt.subplot(526)
plt.arrow(0.2, 0.2, 0.5, 0, overhang=-0.2, fill=False, head_width=0.05, head_length=0.1)
plt.subplot(527)
plt.arrow(0.2, 0.2, 0.5, 0, overhang=-0.4, fill=False, head_width=0.05, head_length=0.1)
plt.subplot(528)
plt.arrow(0.2, 0.2, 0.5, 0, overhang=-0.6, fill=False, head_width=0.05, head_length=0.1)
plt.subplot(529)
plt.arrow(0.2, 0.2, 0.5, 0, overhang=-0.8, fill=False, head_width=0.05, head_length=0.1)
plt.subplot(5,2,10)
plt.arrow(0.2, 0.2, 0.5, 0, overhang=-1, fill=False, head_width=0.05, head_length=0.1)
plt.suptitle(' Without Fill Head Shape using Overhang')
plt.show()
#############################################################
#############################################################
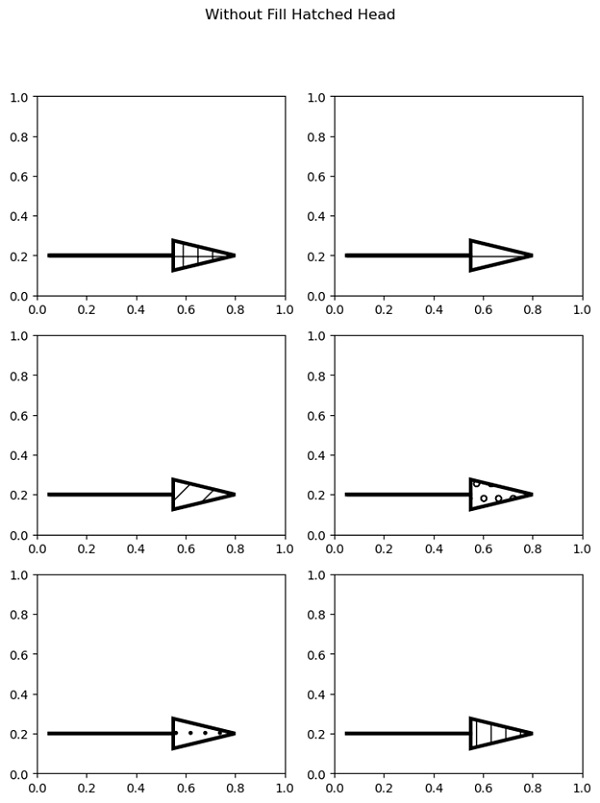
plt.figure(figsize=(8,10))
plt.subplot(321)
plt.arrow(0.05, 0.2, 0.5, 0, linewidth=3.0, hatch='+',
head_width=0.15, head_length=0.25, fill=False)
plt.subplot(322)
plt.arrow(0.05, 0.2, 0.5, 0, linewidth=3.0, hatch='-',
head_width=0.15, head_length=0.25, fill=False)
plt.subplot(323)
plt.arrow(0.05, 0.2, 0.5, 0, linewidth=3.0, hatch='/',
head_width=0.15, head_length=0.25,fill=False)
plt.subplot(324)
plt.arrow(0.05, 0.2, 0.5, 0, linewidth=3.0, hatch='o',
head_width=0.15, head_length=0.25, fill=False)
plt.subplot(325)
plt.arrow(0.05, 0.2, 0.5, 0, linewidth=3.0, hatch='.',
head_width=0.15, head_length=0.25, fill=False)
plt.subplot(326)
plt.arrow(0.05, 0.2, 0.5, 0, linewidth=3.0, hatch='|',
head_width=0.15, head_length=0.25, fill=False)
plt.suptitle('Without Fill Hatched Head')
plt.show()
Output:
Output is as figure
Advertisement
Advertisement