Home »
Python »
Python Data Visualization
Python | Matrix Subplot
Python | Matrix Subplot: In this article, we are going to learn about the matrix subplot and its Python implementation.
Submitted by Anuj Singh, on July 13, 2020
Many times while plotting a figure, we have to compare different functions simultaneously. Then we do have the option to plot in a single figure but this is helpful only for a limited number of functions. If there are a greater number of functions, then plotting in the same figure turns out to be messy. Therefore, matplotlib provides a feature of subploting in which we can plot more than one plot in one figure with more than one graph. Matrix Subplotting is a type of subplotting when we have subplots in a matrix format and a large number of figures can be compared. For example, population data of multiple countries.

Syntax:
#Matrix plotting in a one figure
plt.figure()

plt.subplot(2, 3, 1)
#plt.title('1')

plt.subplot(2, 3, 2)
#plt.title('2')

plt.subplot(2, 3, 3)
#plt.title('3')

plt.subplot(2, 3, 4)
#plt.title('4')

plt.subplot(2, 3, 5)
#plt.title('5')

plt.subplot(2, 3, 6)
#plt.title('6')

plt.show()
Python code for matrix subplot
# Data Visualization using Python
# Matrix Subploting
import numpy as np
import matplotlib.pyplot as plt

x = np.arange(50)

# Example 1 : Default Subplot
plt.figure(figsize=(20,15))
plt.title('MAtrix Subploting')

plt.subplot(2, 3, 1)
plt.plot(x, np.random.randint(0,50,50))
plt.title('1')

plt.subplot(2, 3, 2)
plt.plot(x, np.random.randint(0,50,50), 'r--')
plt.title('2')

plt.subplot(2, 3, 3)
plt.plot(x, np.random.randint(0,50,50), 'b-')
plt.title('3')

plt.subplot(2, 3, 4)
plt.plot(x, np.random.randint(0,50,50), '.-')
plt.title('4')

plt.subplot(2, 3, 5)
plt.plot(x, np.random.randint(0,50,50), '.')
plt.title('5')

plt.subplot(2, 3, 6)
plt.plot(x, np.random.randint(0,50,50), 'g')
plt.title('6')

plt.show()
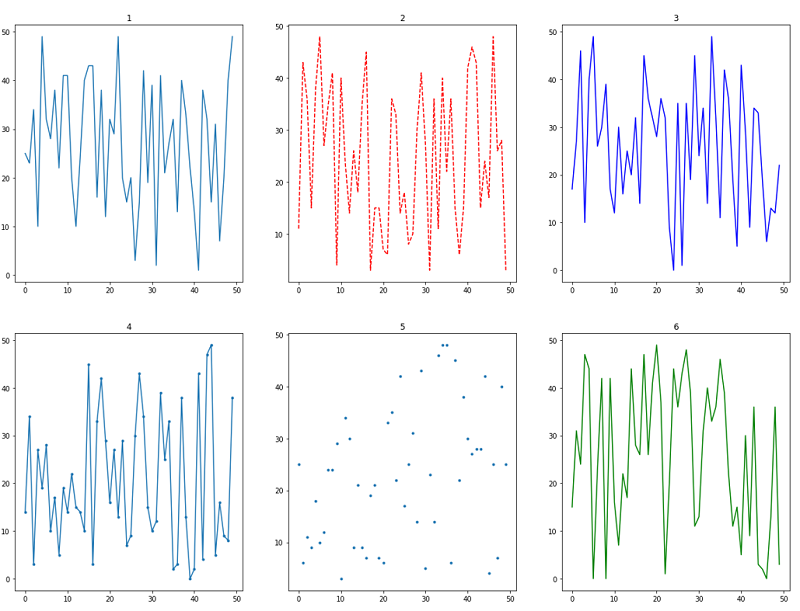
Output:
Output is as figure
Advertisement
Advertisement