Home »
Python »
Python Data Visualization
Python | Adding Lowercase/Uppercase Lambda in Plot Label
Here, we are going to learn how to add lowercase/uppercase lambda in plot label in Python?
Submitted by Anuj Singh, on July 20, 2020
ƛ(lowercase lambda) and 𐊍(uppercase lambda) are very often used greek mathematical letters. They are mostly used in physics and chemistry when there is topic related change (for example energy change, mass change, velocity change) and therefore, they have registered importance in languages.
Therefore, matplotlib has defined a command for ƛ/𐊍 usage.
In this article, we are going to add ƛ/𐊍 using a command in matplotlib.
1) Lowercase lambda
plt.text(3, 0.4, r'$\lambda=100$')
#Adding ƛ/𐊍 as text
plt.title('Lowercase lambda 'r'$\lambda=100$')
#Adding ƛ/𐊍 in title of the figure
plt.xlabel('Lowercase lambda ('r'$\lambda=100)$')
#Adding ƛ/𐊍 in x axis label of the figure

plt.ylabel('Lowercase lambda ('r'$\lambda=100)$')
#Adding ƛ/𐊍 in y axis label of the figure
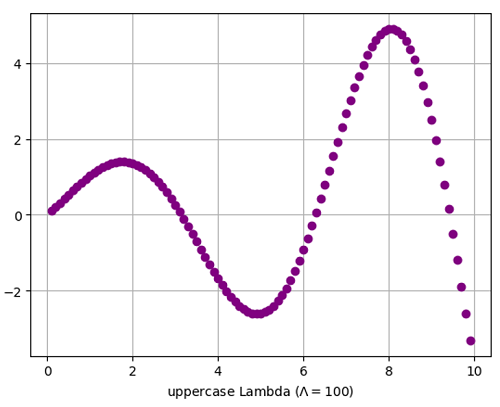
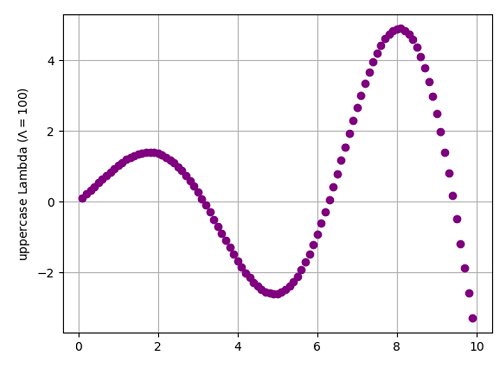
2) Uppercase lambda
plt.text(3, 0.4, r'$\Lambda=100$')
#Adding ƛ/𐊍 as text
plt.title('Uppercase Lambda 'r'$\Lambda=100$')
#Adding ƛ/𐊍 in title of the figure

plt.xlabel('uppercase Lambda ('r'$\Lambda=100)$')
#Adding ƛ/𐊍 in x axis label of the figure
plt.ylabel('uppercase Lambda ('r'$\Lambda=100)$')
#Adding ƛ/𐊍 in y axis label of the figure
Python code for adding lowercase/uppercase lambda in plot label
import numpy as np
import matplotlib.pyplot as plt
x = np.arange(0.1, 10, 0.1)
y = np.sin(x)*np.exp(x/5)
#Lowercase lambda
#In text
plt.figure()
plt.plot(x,y, 'o', color='purple')
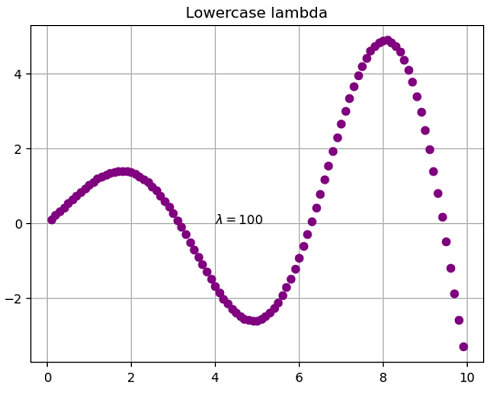
plt.title('Lowercase lambda')
plt.text(4, 0.0, r'$\lambda=100$')
plt.grid()
plt.show()
#In title
plt.figure()
plt.plot(x,y, 'o', color='purple')
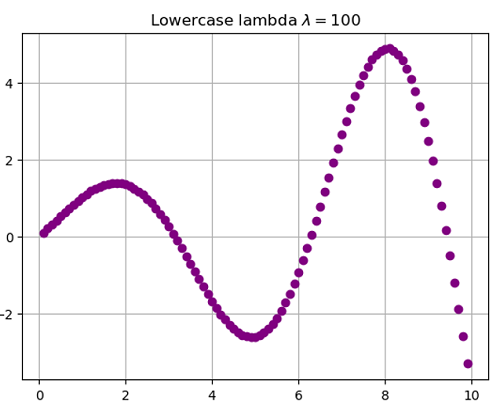
plt.title('Lowercase lambda 'r'$\lambda=100$')
plt.grid()
plt.show()
#In x-axis label
plt.figure()
plt.plot(x,y, 'o', color='purple')
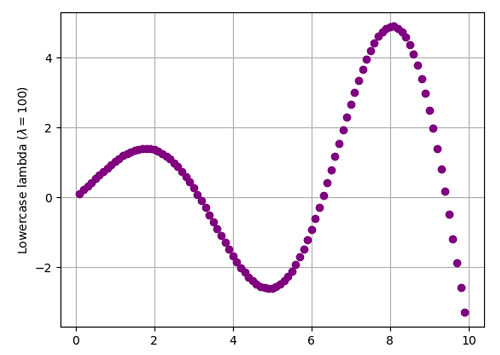
plt.xlabel('Lowercase lambda ('r'$\lambda=100)$')
plt.grid()
plt.show()
#In y-axis label
plt.figure()
plt.plot(x,y, 'o', color='purple')
plt.ylabel('Lowercase lambda ('r'$\lambda=100)$')
plt.grid()
plt.show()
#Uppercase Lambda
#In text
plt.figure()
plt.plot(x,y, 'o', color='purple')
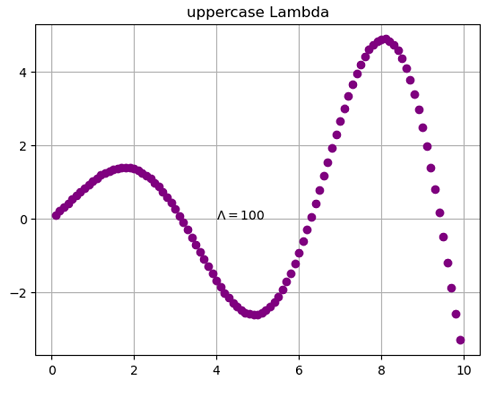
plt.title('uppercase Lambda')
plt.text(4, 0.0, r'$\Lambda=100$')
plt.grid()
plt.show()
#In title
plt.figure()
plt.plot(x,y, 'o', color='purple')
plt.title('uppercase Lambda 'r'$\Lambda=100$')
plt.grid()
plt.show()
#In x-axis label
plt.figure()
plt.plot(x,y, 'o', color='purple')
plt.xlabel('uppercase Lambda ('r'$\Lambda=100)$')
plt.grid()
plt.show()
#In y-axis label
plt.figure()
plt.plot(x,y, 'o', color='purple')
plt.ylabel('uppercase Lambda ('r'$\Lambda=100)$')
plt.grid()
plt.show()
Output:
Output is as figure
Advertisement
Advertisement