Home »
R Language
Line Charts in R Language
In this tutorial, we are going to learn about the Line Charts in R Language, syntax of the line graph, how to add a title and color in the line chart, etc.
Submitted by Bhavya Sri Khandrika, on December 07, 2020
How can a line chart be defined?
In simple language, the Line can be defined as the connection between two points in the space.
In the same way, a line graph can be expressed as the connection of the points which are in a series. The segments are drawn between the successive points and thus finally we get a line graph. The line chart is the pictorial representation of the various trends in the varying data. Many times, the line graph is also considered as a line chart too.
The general observation is that the above-considered points will always be ordered in their coordinate (either x or y) value, but mostly we assume the x coordinate only.
Syntax of the line graph in the R language
The R language has many inbuilt functions to enable a comfortable atmosphere for the R programmers. Keeping in view of the above point, the R libraries and other functions are built. One such amazing method is plot(), this is the function responsible for creating the line graphs.
The syntax of the plot() function is as follows:
plot( v, type, col, xlab, ylab)
Coming to the explanation of the parameters used in the above syntax is as follows:
- V is the vector that contains the numerical elements or values in it.
- The type takes input as 'p', 'l' or 'o'. The p is for drawing the points, whereas the l is used to draw the lines and finally the o stands for drawing the points and as well as the lines too.
- xlab is the label given for the x-axis.
- ylab is the label defined for the y-axis.
- col is used as the mnemonics for the colors. The various colors are designated for the points and the corresponding lines in the line graph.
Let us consider an example and demonstrate the usage of the type that takes 'O'. For that take an input vector that is holding the numerical values. One must remember that the following R code will be created and thus saved as a line chart in the present working directory of the R studio.
- Step 1: Create the input vector with various numerical values.
- Step 2: In this step, we will plot the line chart for the considered line chart.
- Step 3: Saving the file.
Code:
v <- c(2,16,8,30,11)

plot(v,type = "o")

dev.off()
The above R code will print the following line chart:

How to add a title and color in the line chart?
The line chart can be made attractive by expanding the chart code with some cool features of the R language. Here one can assign the title to the line chart. In addition to that, the user can also color the points and the lines in the line chart. The labels can also be allotted to the axes in the line chart by using the R language.
Consider the following example for the demonstration of the above-discussed statements:
- Step 1: Create the input vector with various numerical values.
- Step 2: In this step, we will plot the line chart for the considered line chart.
- Step 3: Save the file.
Code:
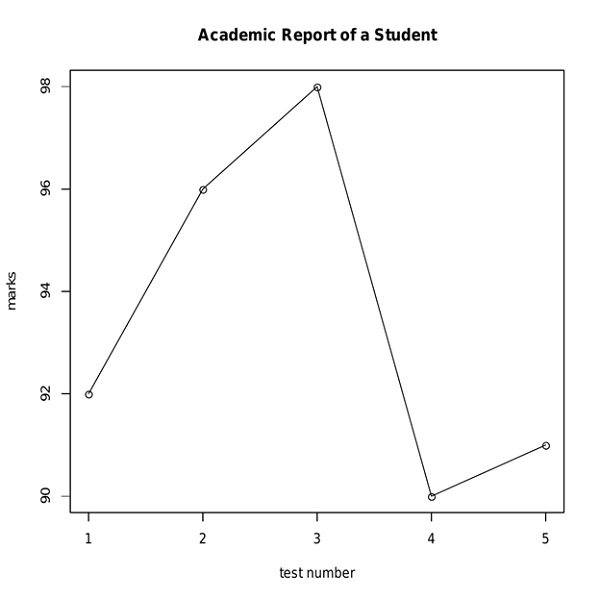
v <- c(92,96,98,90,91)

plot(v,type = "o", col = "black", xlab = "test number", ylab = "marks", main = "Academic Report of a Student")

dev.off()
The output of the above code is as follows:
The data in practical times include a huge number of numerical elements and also in some times, the line charts are to be plotted against the same parameter but in two different conditions. In that case, the concept of multiple lines in a single line chart can be implemented, and thus the required data can be illustrated in the form of a line chart.
How the multiple lines are printed in a single line chart?
The line charts can have one or more lines. This can be achieved by the function named lines() in the R language.
Here, when the user gives one or more input vectors then, initially the first vector will be plotted on the line chart. Now, in the later turns, the other vectors will be considered and the same procedure is followed.
So it can be concluded that at one instant, the input of one vector will be considered at a time and it is replicated on the line chart.
The lines() function stated above uses the later input vectors to draw the next line or multiples lines on the same line chart.
The concept of multiple lines in the single line chart can be illustrated with the following example.
- Step 1: Create the input vector with various numerical values.
- Step 2: Allocate a name for the chart file.
- Step 3: In this step, we will plot the line chart for the considered line chart.
- Step 4: Save the file.
Code:
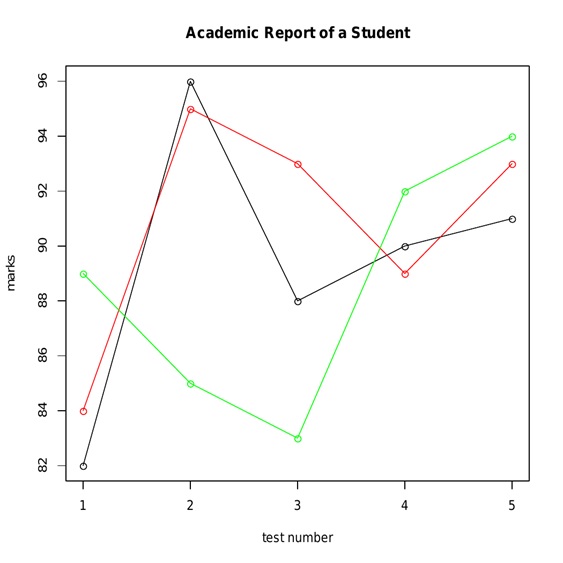
r <- c(82,96,88,90,91)
p <- c(84,95,93,89,93)
q <- c(89,85,83,92,94)

png(file = "linechart_with_multiple_lines.jpg")

plot(r,type = "o", col = "black", xlab = "test number", ylab = "marks", main = "Academic Report of a Student")

lines(p, type = "o", col = "red")

lines(q, type = "o", col = "green")

dev.off()
The output of the above R code is as follows:
In the above example you may have some across the point where the line chart is given name and saved in the local computer. Considering the same line of code:
-> Allocating a name for the chart file
png(file = "linechart_with_multiple_lines.jpg")
Here, the line chart is saved as a png file in the local computer. In this way, the user can include the line of code for saving the line chart on his or her computer while coding itself. This feature of R language is assisting the programmers in dealing with the huge line of code. By this, the user will be free from the risk of losing the process of his or her work when handling with the real time lengthy codes.
Advertisement
Advertisement