Home »
Data Science
Exploratory Data Analysis in Data Science
Here, we are going to learn about the Exploratory Data Analysis (EDA), its significances, EDA techniques, Types of Exploratory Data Analysis and Exploratory Data Analysis Tools.
Submitted by Palkesh Jain, on March 09, 2021
Exploratory Data Analysis refers to the essential method of conducting initial data analysis to recognize trends, find anomalies, test hypotheses, and use summary statistics and graphical representations to verify conclusions. In other words, Exploratory Data Analysis in statistics is an approach to analyzing data sets to summarize their key features, often with visual methods. A statistical model can be used or not, but EDA is primarily intended to see what the data can tell us beyond the formal task of modeling or hypothesis testing. Exploratory Data Analysis (EDA) in data mining is an approach to analyzing datasets, sometimes through visual tools, to summarize their key characteristics. EDA is used to see before the modeling task what the data will tell us. A column of numbers or a whole spreadsheet is not easy to look at and evaluate essential data characteristics. To gain insights by looking at simple numbers can be repetitive, dull, and/or daunting. An important step in any research study is Exploratory Data Analysis (EDA). The primary objective of the exploratory analysis is to analyze the distribution data, outliers, and anomalies to lead the hypothesis to specific research. It also provides hypothesis creation methods by visualizing and interpreting the data generally through graphical representation.
Exploratory Data Analysis (EDA) is a data analysis approach/philosophy that employs a range of (mostly graphical) techniques to,
- Maximize a data set's insight;
- Uncover the basic structure;
- Extract main variables;
- Detect anomalies and outliers;
- Underlying assumptions test;
- Build models that are parsimonious; and
- Optimal factor settings are calculated.
Why is Exploratory Data Analysis important?
EDA's primary aim is to help look at facts before making any conclusions. As well as better understanding trends within the data, detecting outliers or anomalous events, finding interesting relationships between the variables, this can help identify obvious errors. To ensure that the outputs they generate are true and relevant to any desired business results and objectives, data scientists should use exploratory analysis.
For standard deviations, categorical variables, and confidence intervals, When EDA is complete and observations are gathered, its functionality can then be used to analyze or model more advanced data, including machine learning.
EDA techniques based on the type of data
With few quantitative techniques, most EDA methods are graphical. The explanation for the strong dependence on graphics is that the primary function of EDA is to explore open-mindedly by its very nature, and graphics gives the analysts unprecedented power to do so, tempting the data to expose its structural secrets, and always being ready to gain some new insight into the data, often unsuspected. Graphics, of course, have unprecedented ability to do this by the inherent pattern-recognition capacities we all possess.


Types of Exploratory Data Analysis
There are four types of EDA:
- Non-graphical Univariate - This is the simplest method of data analysis, where only one variable consists of the data being analyzed. Since it's a single variable, triggers or partnerships are not dealt with. The primary aim of the univariate analysis is to define the data and recognize trends within it.
- Graphic Univariate - non-graphical approaches do not provide the data with a complete description. Therefore, graphical methods are needed. Popular Univariate Graphics Styles include Stem-and-leaf plots, which display all the values of the data and the distribution form. Histograms, a bar graph where the bar represents the frequency (count) or proportion (count/total count) of cases for a value set. Box graph, which graphically displays the minimum, first quartile, median, third quartile, and maximum five-number description.
- Nongraphical multivariate - Multivariate data derives from more than one variable. The relationship between two or more data variables by cross-tabulation or statistics is typically demonstrated by multivariate non-graphical EDA techniques.
- Multivariate graphical - Multivariate data shows relationships between two or more data sets using the graphical method. A clustered bar plot or bar map with each group representing one level of one of the variables and each bar in a group representing the levels of the other variable is the most widely used graph.
With EDA tools, basic statistical functions, and techniques that you can perform include:
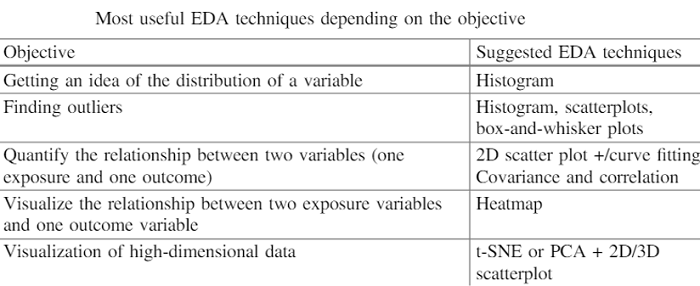
- Techniques for clustering and dimension reduction help to construct graphical displays of high-dimensional data containing several variables.
- Univariate visualization provides summary statistics of each area in the raw dataset.
- Visualizations of bivariate and summary statistics allow us to analyze the relationship between each dataset variable and the target variable you are looking at.
- Multivariate visualizations allow us for mapping and understanding interactions between different fields in the data.
Exploratory Data Analysis Tools
The two most widely used data science instruments to build an EDA are the Python and R languages.
- Python: Using python, EDA can be done to find the missing value in a data set. The definition of results, managing outliers, having insights through the plots is other functions that can be carried out. It is an appealing tool for EDA because of its high-level, built-in data structure, and dynamic typing and binding. A hectic job that takes a lot of time is analyzing a dataset. Python offers some open-source modules which can automate the entire EDA process and help save time.
- R: It is an open-source programming language platform and a free statistical computing and graphics software environment provided by the R Foundation for Statistical Computing. In developing statistical observations and data analysis, the R language is commonly used by statisticians in data science.
Advertisement
Advertisement