Home »
R Language
Pie Charts in R Language
In this tutorial, we are going to learn about the Pie Charts in R Language, the syntax of the creation of the pie chart, pie chart titles, labels, and the colors for the slices, etc.
Submitted by Bhavya Sri Khandrika, on December 07, 2020
We are acquainted with the fact that the R programming language is having several libraries accompanying many functions for drawing or creating various types of graphs and charts.
As a child, you might have experienced drawing the pie chart as part of the academic schedule. But the question is how we can define the Pie chart in the terms of the visualization techniques.
Here is the simple definition of a pie chart:
"A pie chart is an illustration of the values or numerical elements in the form of slices in a circle by using various colors. Whatever the slices we have named in the above statement, they can be labeled using the R code. A detailed description of the slices along with the numbers corresponding to the slices displayed can be shown well in the pie-chart."
The Syntax of the creation of the Pie Chart
Here, we can use the pie() function for creating or drawing a pie chart in R. The only thing one must keep in view is that the pie() function takes only positive values or numbers as the input in the form of vectors.
We have additional features like labels, titles, and colors, etc. that make the pie chart more attractive and thus increases the readability of the pie chart.
Syntax:
pie(X, Labels, Radius, Main, Col, Clockwise)
Coming to the description of the various parameters discussed in the above syntax are as follows:
- X is the input vector that contains the input numerical or input values that are to be used in the construction of the pie chart
- Labels are generally used to describe the slices in the pie chart
- The term Radius resembles the radius of the circle or the pie chart
- Main is the parameter or the argument that holds or names the pie chart with a given title
- Col is the argument that takes various colors as the input and paints different colors to the slices
- Clockwise determines the direction of the slices based on their values
To understand the above concept let us consider the below R code for a better understanding of the concept:
- Step 1: Create an input vector that consists of numeric values for plotting the pie chart.
- Step 2: Save the pie chart with the name given by the user.
- Step 3: Plotting a pie chart with the considered input values of the vector or matrix.
- Step 4: Save the pie chart file.
Code:
x <- c(91, 85, 95, 75,82)

names <- c("Ramesh ", "Arjun", "Siri", "Hrudya", "Teja")

png(file = "marks.jpg")

pie(x,names)

dev.off()
The output of the above R code is as follows:

Pie chart Titles, Labels, and the colors for the slices
A simple pie chart can be made more attractive by infusing other parameters like a labeling pie chart, giving several colors to the slices, etc. This will surely increase the readability of the pie chart.
The above task can be accomplished by instilling other features or arguments in the pie chart function.
We can also pass the rainbow color palette that in turn will paint the slices with various colors of the rainbow. This can be done using the Col argument or the feature of the R programming language.
One must note that the length of the considered palette will always be the same as that of the values considered in the pie chart. Therefore, to make sure they are identical we can use the length() function to verify the same.
Going forward, it is time to make our concepts more clear by considering an example R code that demonstrates the above concept:
- Step 1: Create an input vector that consists the numeric values for plotting the pie chart.
- Step 2: Save the pie chart with the name given by the user.
- Step 3: Plotting a pie chart with the considered input values of the vector or matrix and also naming the pie chart with the name given by the user.
- Step 4: Saving the pie chart file.
Code:
x <- c(91, 85, 95, 75,82)
names <- c("Ramesh ", "Arjun", "Siri", "Hrudya", "Teja")
png(file = "marks.jpg")
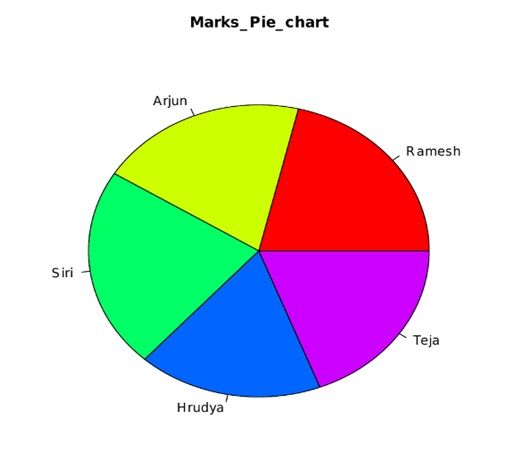
pie(x,names,main="Marks_Pie_chart",col=rainbow(length(x)))
dev.off()
On successful compilation and running of the above R code, we get the below output:
Pie Chart Slice Percentage and the Chart Legend
We generally encounter a few aptitude problems where we need to find the percentage of the required parameter in the pie chart.
Finding the slice percentage and the legend attributes are two other popular features of the pie charts in the R programming language. Here one can add a legend for the considered pie chart using the legend() function in the R programming language.
Following is the syntax for implementing the above discussed additional features.
legend( x, y=NULL, legend, fill, col, bg)
A detailed description of the above-mentioned parameters is in the below text:
- X and Y resemble the coordinates that are needed to be considered for creating a legend.
- Legend is the text for the considered legend of the pie chart
- Fill is used to paint the boxes that are beside the text of the legend
- Col is used in coloring thee point and lines that are beside to the legend text
- bg gives the legend a background-color
Consider the following R code for the clear depiction of the concept mentioned above:
- Step 1 : Create an input vector that consists of numeric values for plotting the pie chart.
- Step 2 : Saving the pie chart with the name given by the user.
- Step 3 : Plotting a pie chart with the considered input values of the vector or matrix and also naming the pie chart with the name given by the user.
- Step 4 : Saving the pie chart file.
Code:
png(file = "marks_piechart_percentage.jpg")

x <- c(91, 85, 95, 75,82)

labels <- c("Ramesh ", "Arjun", "Siri", "Hrudya", "Teja")

piechart_in_percentages<- round(100*x/sum(x), 1)

pie(x,labels= piechart_in_percentages, main = "Marks Pie Chart in Percentage",col = rainbow(length(x)))

legend("topright", c("Ramesh", "Arjun", "Siri", "Hrudya","Teja"), cex = 0.8,

fill = rainbow(length(x)))

dev.off()
On running the above R code without the programming errors, we get the following output:

3-Dimensional Pie Charts
The R programming language enables users with an easy environment for creating the 3-Dimensional pie charts for the considered data.
To achieve this goal we have a package named plotrix in the R programming language. Here in this particular package, we have a function named pie3D() for drawing a pie chart in the three dimensions. However one must note that the arguments of the plotrix() function are identical to that of the pie() function.
Consider the below code for a better understanding of the above concept:
- Step 1: Importing the required library for displaying the 3-dimensional pie chart.
- Step 2: Create an input vector that consists of numeric values for plotting the pie chart.
- Step 3: Save the pie chart with the name given by the user.
- Step 4: Plot the pie chart with the considered input values of the vector or matrix and also naming the pie chart with the name given by the user.
- Step 5: Saving the pie chart file.
Code:
library(plotrix)
x <- c(91, 85, 95, 75,82)
names <- c("Ramesh ", "Arjun", "Siri", "Hrudya", "Teja")
png(file = "marks_3D_piechart.jpg")
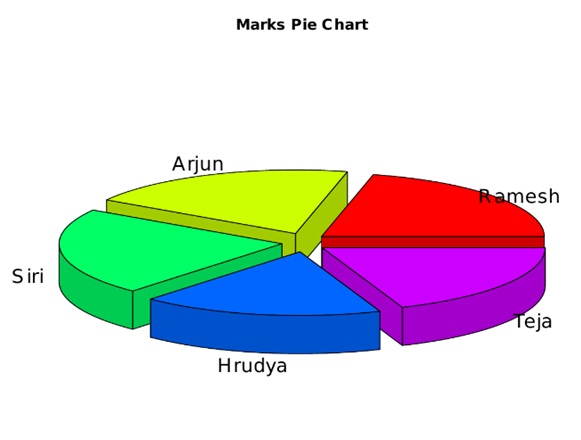
pie3D(x,labels=names,explode = 0.1, main = "Marks Pie Chart ")
dev.off()
The output of the above code is as follows:
Note:
The pie charts are usually not recommended when it comes to documentation. This is because the characteristics of the pie charts in the R programming language are quite limited. Therefore, R programmers generally go for the implementation of either the bar or dot plots over the pie charts. This is because using either dot plot or the bar plot we can measure the length of the bars very accurately when compared to the volume measurement of the slices is quite difficult.
Apart from all the above discussed details of the pie chart, there is one more thing to understand. We can also save the pie chart while programming itself and thus reduce the time of the programmer and increase the efficiency of the R code. This can be achieved by following the below syntax:
png(file = " name of the chart.format of file ")
The above syntax will save the pie chart with the given name. The user can also save the chart in various other formats like jpeg, jpg, etc.
Note:
The above syntax executes successfully only on the R compiler which is installed on the local computer. Whereas when the above code is run on an online compiler then that will leave an error.