Home »
R Language
Bar Charts in R Language
In this tutorial, we are going to learn about the Bar Charts in R Language, creating a bar chart, example to create a bar chart in r programming language, etc.
Submitted by Bhavya Sri Khandrika, on December 07, 2020
The R language has various inbuilt features in it that assist the users in their work. Coming to the data visualization techniques, we have seen the general terms of it in the other article. Well, it is time to learn about one of the Data visualization techniques.
Recall the bar graph that we studied in the earlier days of our school. We used to take a graph of a 16x24 size grid with lines and point the data and later draw the bars or so-called vertical columns.
Here we have the same concept to the R,
Bar Chart
A bar chart is one of the data visualization techniques that plots the considered data in the form of rectangular bars where the length of each bar will be proportional to the value of the taken data.
Creating a bar chart
R has an inbuilt function named barplot() that helps the user in creating the bar charts or graphs.
In addition to the above information, one must also note the point that the R language can create both the horizontal bars along vertical bars in the considered bar chart. Also, bar charts can be made more attractive by using various colors for the different bars based on their values.
Syntax:
barplot(H, xlab, ylab, main, names.arg, col)
The description of various parameters stated in the above syntax.
- H is the input vector or also it can be a matrix that stores the numeric values for plotting the bar chart
- xlab is the label for the x-axis
- ylab is the label given for the y-axis.
- col is used to color the bars in the chart
- main is nothing but it gives the title to the chart considered
- arg is the vector that contains the names which in-turn appear at the end of each bar.
We can save the bar chart while programming itself. This can be achieved by following the below syntax:
png(file = " name of the chart ")
The above syntax will save the bar chart with the given name. The user can also save the chart in various other formats like jpeg, jpg, etc.
Note: The above syntax executes successfully only on the R compiler which is installed on the local computer. Whereas when the above code is run on an online compiler then that will leave an error.
Example to create a bar chart in R programming Language
The below steps will show the creation of a bar graph in R.
- Step 1: Create an input vector that consists of numeric values for plotting the bar chart.
- Step 2: Saving the bar chart with the name given by the user.
- Step 3: Plotting a bar chart with the considered input values of the vector or matrix.
- Step 4: Save the bar chart file.
Code:
H<- c(02,20,16,12,25,30)

png(file = "simple_bar_chart.png")

barplot(H)

dev.off()
The later step of saving the bar chart file given ends the executed program.
Output:

Bar Chart with Title, Labels, and Colors
We can add various features to the existing bar chart to make it more attractive and easier to understand. To accomplish this task, we add a few more functions or arguments to the barplot() function.
Here, we will be adding the following things to the bar chart:
- Giving a title to the graph.
- Changing the color of the bars.
- Giving the name to each bar.
The below steps demonstrate the above-explained concept:
- Step 1: Create two input vectors that consist of the numeric values for plotting the bar chart.
- Step 2: Saving the bar chart with the name given by the user.
- Step 3: Plotting the bar chart with the input values considered. and usage of additional features like giving title to bar chart adding colors to the bars is shown.
- Step 4: Saving the bar chart file.
Code:
H<- c(22,20,16,18,25)

M <- c("2012","2014","2016","2018","2020")

png(file = "Rain(in cm)_chart.png")

barplot(H,names.arg=M, xlab="Year", ylab="Rain(in cm)", col="light green", main="Rain Measuring (in cm) Chart", border="blue")

dev.off()
Output:

The border in the above code deals with painting the border of the bar with a custom color of the user choice. This enables the observer to have a clear view of the values of the bar chart. The prime intention of coloring the bars, or giving a bar chart a title is to increase the readability such that the user or the observer will get to understand the things within less time.
Group/Multiple Bar Charts and the Stacked Bar charts
We do face a situation where we need to construct the bar chart for the same parameter at different times. An efficient R programmer will construct a stacked Bar chart to avoid such obstacles in his programming.
It is possible to create group bar charts or stacked bars by using R. We use matrices as the input carrying data objects for each bar.
Here is a way to create multiple bar graphs :
- Step 1: Create the input vectors for storing numeric values.
- Step 2: Consider the matrix of input numerical values for the stacked bar graph.
- Step 3: Saving the bar chart with the name given by the user.
- Step 4: Plot the values in the form of the stacked bar graph or chart with the colors and other attractive features.
- Step 5: Include a legend in the bar chart or graph for a better understanding or high readability.
- Step 6: Saving the bar chart with the given name.
Code:
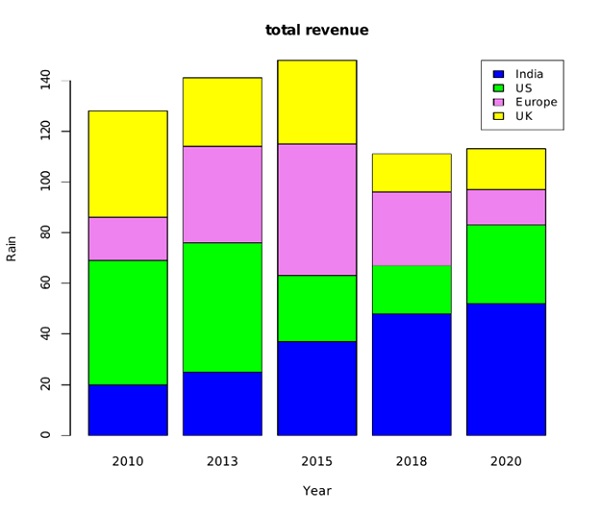
colors = c("blue","green","violet","yellow")

years <- c("2010","2013","2015","2018","2020")

countries <- c("India","US","Europe","UK")

input <- matrix(c(20,25,37,48,52,49,51,26,19,31,17,38,52,29,14,42,27,33,15,16), nrow = 4, ncol = 5, byrow = TRUE)

png(file = "Yearly_Report.png")

barplot(input, main = "total revenue", names.arg = years, xlab = "Year", ylab = "Rain", col = colors)

legend("topright", countries, cex = 0.95, fill = colors)

dev.off()
The cex parameter is mainly used for either increasing or decreasing the font of the labels of the bars at the extreme right, left or middle of the bar chart.
Output:
Advertisement
Advertisement