Home »
Python »
Python Data Visualization
Python | Plot the power spectral density using Matplotlib
In this tutorial, we are going to learn how to Plot the power spectral density using Matplotlib in Python?
Submitted by Anuj Singh, on July 22, 2020
The power spectral density (known as PSD) is calculated using Welch's averaged periodogram method. Matplotlib has provided a function for plotting PSD directly i.e. matplotlib.pyplot.psd(). It is the most used function for signal processing and therefore, we are introducing an example to illustrate its usage.
matplotlib.pyplot.legend(shadow=True)


Python code for plot the power spectral density using matplotlib
import matplotlib.pyplot as plt
import numpy as np
dt = 0.01
t = np.arange(0, 10, dt)
nse = np.random.randn(len(t))
r = np.exp(-t / 0.05)
cnse = np.convolve(nse, r) * dt
cnse = cnse[:len(t)]
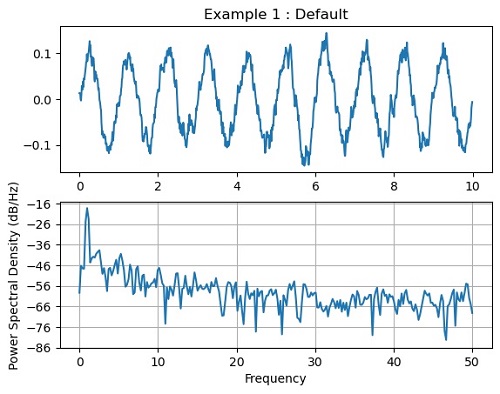
#Default
s = 0.1 * np.sin(2 * np.pi * t) + cnse
plt.subplot(211)
plt.title('Example 1 : Default')
plt.plot(t, s)
plt.subplot(212)
plt.psd(s, 512, 1 / dt)
plt.show()
s = 0.1 * np.sin(2 * np.pi * t) + cnse
plt.subplot(211)
plt.title('Example 2 : PSD change')
plt.plot(t, s)
plt.subplot(212)
plt.psd(s, 256, 1 / dt)
plt.show()
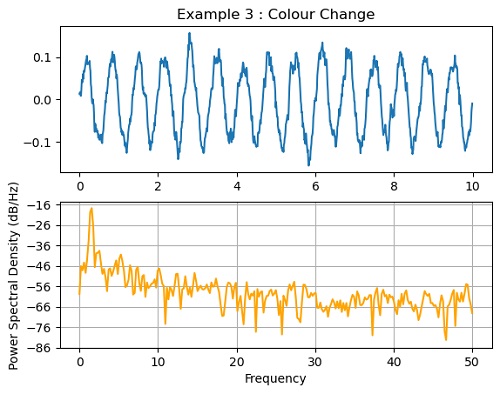
s = 0.1 * np.sin(3 * np.pi * t) + cnse
plt.subplot(211)
plt.title('Example 3 : Colour Change')
plt.plot(t, s)
plt.subplot(212)
plt.psd(s, 512, 1 / dt, color='orange')
plt.show()
s = 0.05 * np.sin(2 * np.pi * t) + cnse
plt.subplot(211)
plt.title('Example 4 : Colour and Signal Change')
plt.plot(t, s)
plt.subplot(212)
plt.psd(s, 512, 1 / dt, color='purple')
plt.show()
Output:
Output is as figure